About FourScore
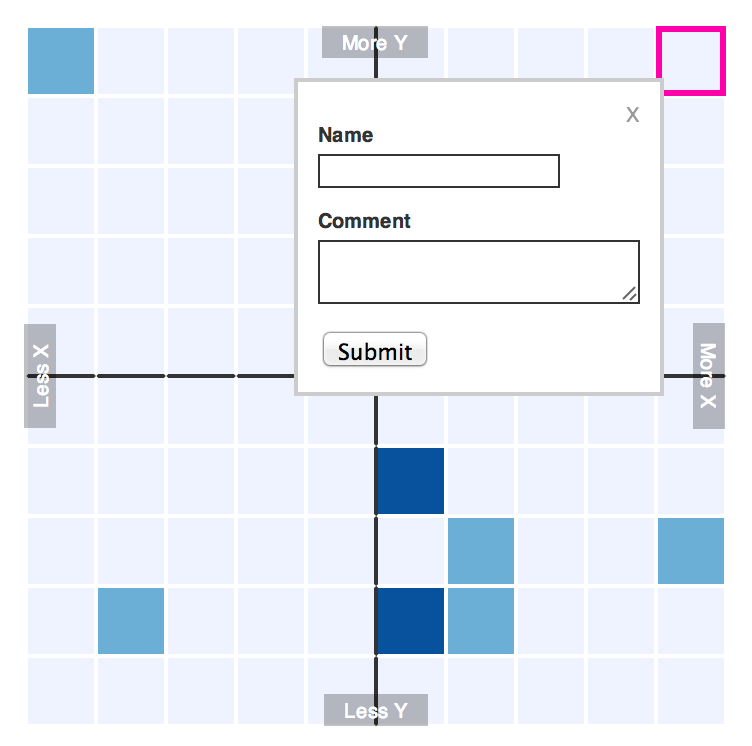
FourScore is a bootstrapper for letting audience members mark their position on a grid, like the New York magazine approval matrix and the WNYC Sentiment Tracker.
The grid will be color-coded by the number of responses on each square. You can supply additional form fields so that users can submit things like their name, their age, or a comment along with their position on the grid.
Requirements
Optional
- Underscore or Handlebars for templating, if you want to display the results of a custom form.
- ColorBrewer.js if you want to use its built-in color scales.
- Tabletop.js if you want existing responses to be loaded from a Google Spreadsheet.
Tested with
- Safari
- Chrome
- Firefox
- IE8+
Most of FourScore should work out of the box. The only two things you MUST provide are:
- A data source: a URL that contains existing responses. This will be loaded when the grid is initially drawn in order to color code the squares and display things like comments if you're gathering those. You can use a Google form for this.
- A data destination: a URL to send new form responses to. This will get a POST with new data if someone clicks on the grid and submits a response. You can use a Google form for this.
Quickstart: use a Google form
To power a FourScore grid with a Google spreadsheet, do the following:
- Clone the FourScore repo to download the files.
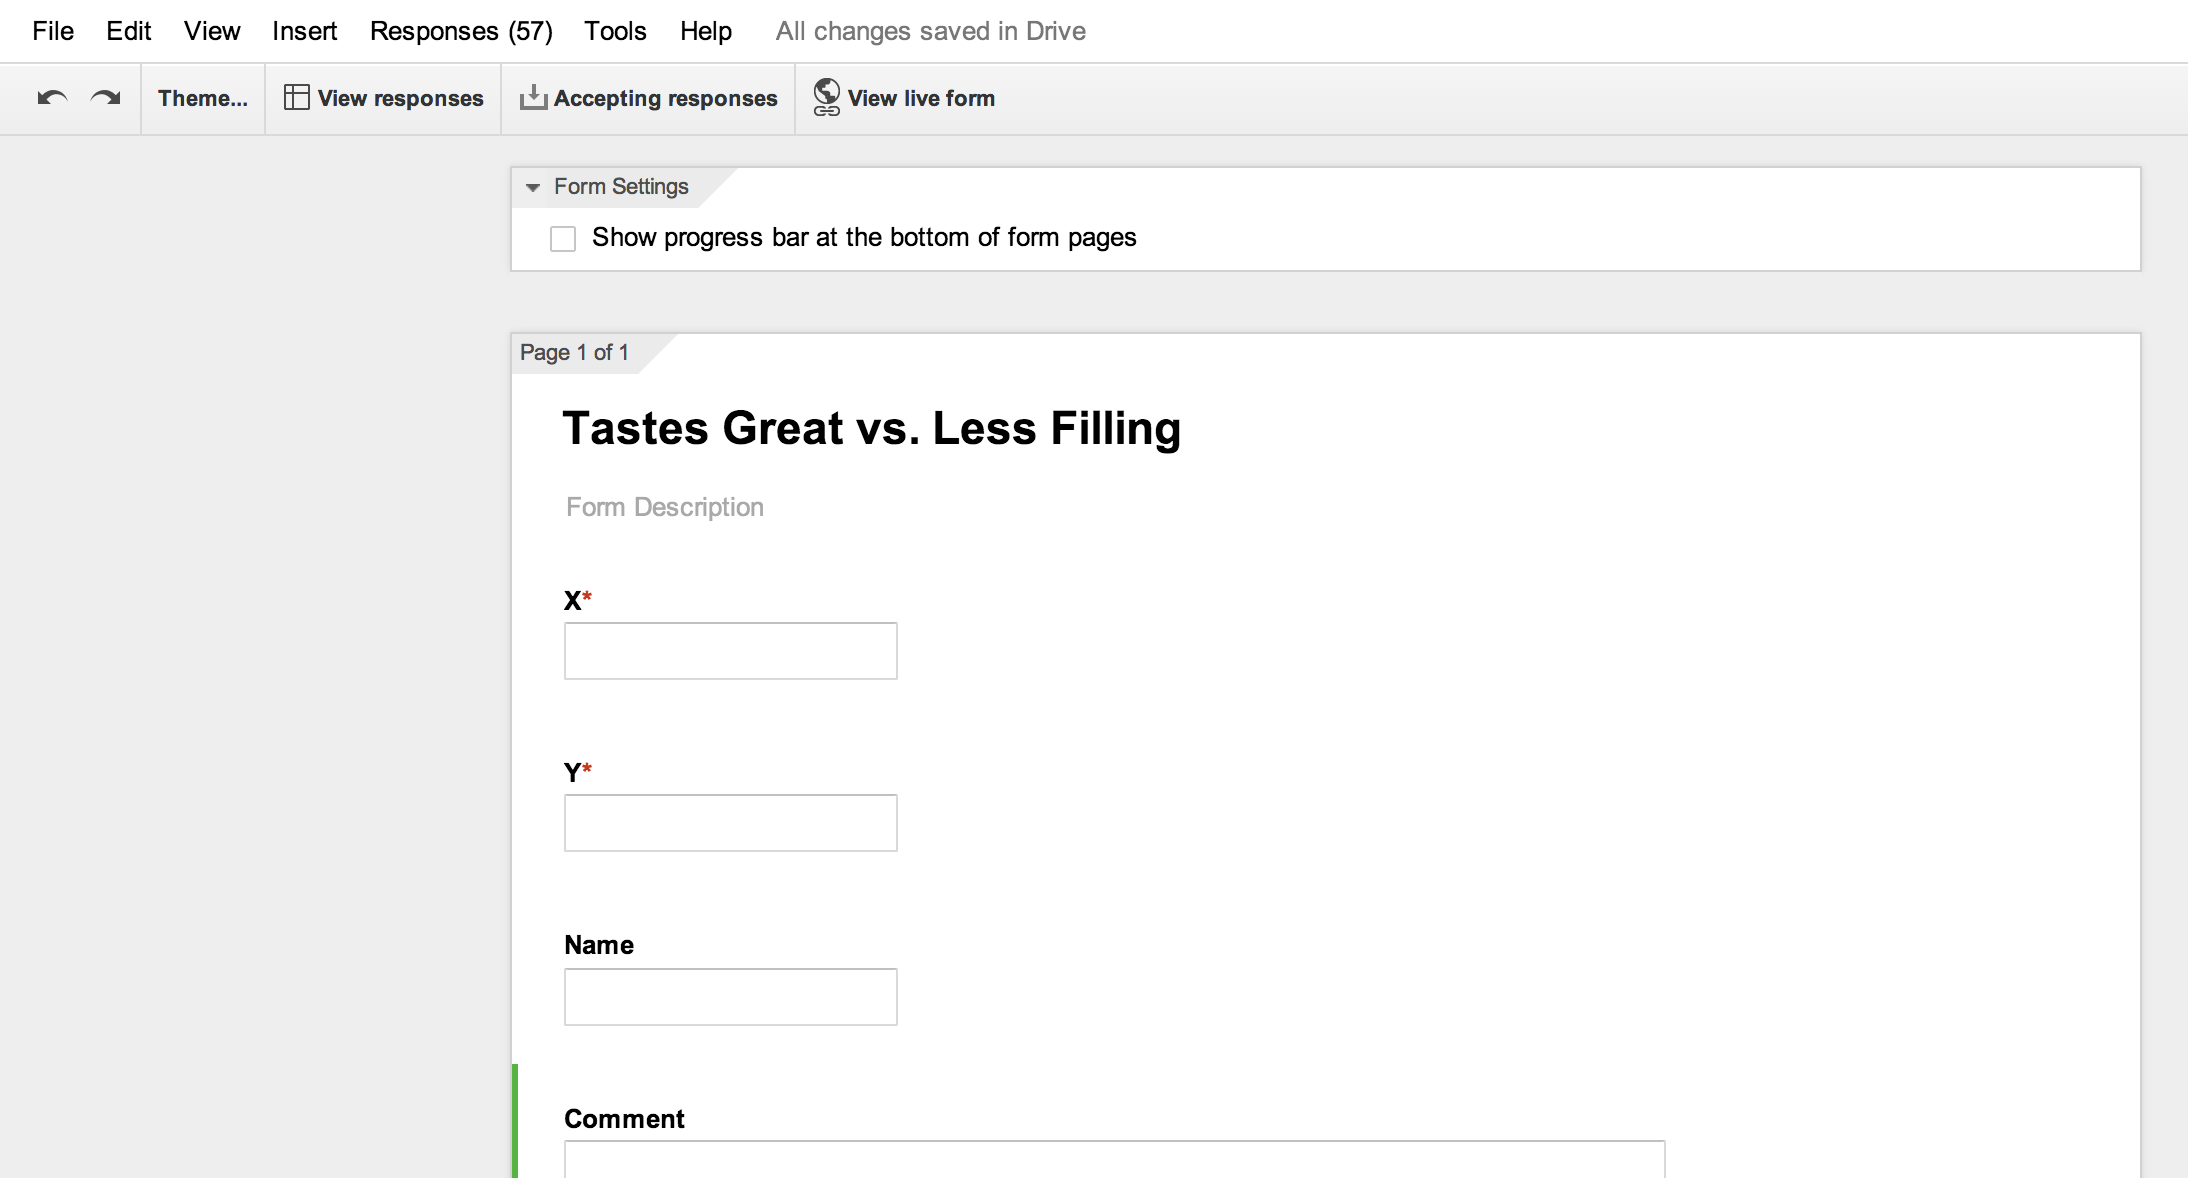
- Create a Google form. It must have a field called
Xand a field calledY. You can add as many other fields as you want, like a field for name and a field for gender. Any form fields you add besidesXandYwill be turned into a form that appears when a user clicks on the grid. If you make fields required, they will also be required when a user submits the form. - Turn the information about the Google form into a set of configuration options to put into the
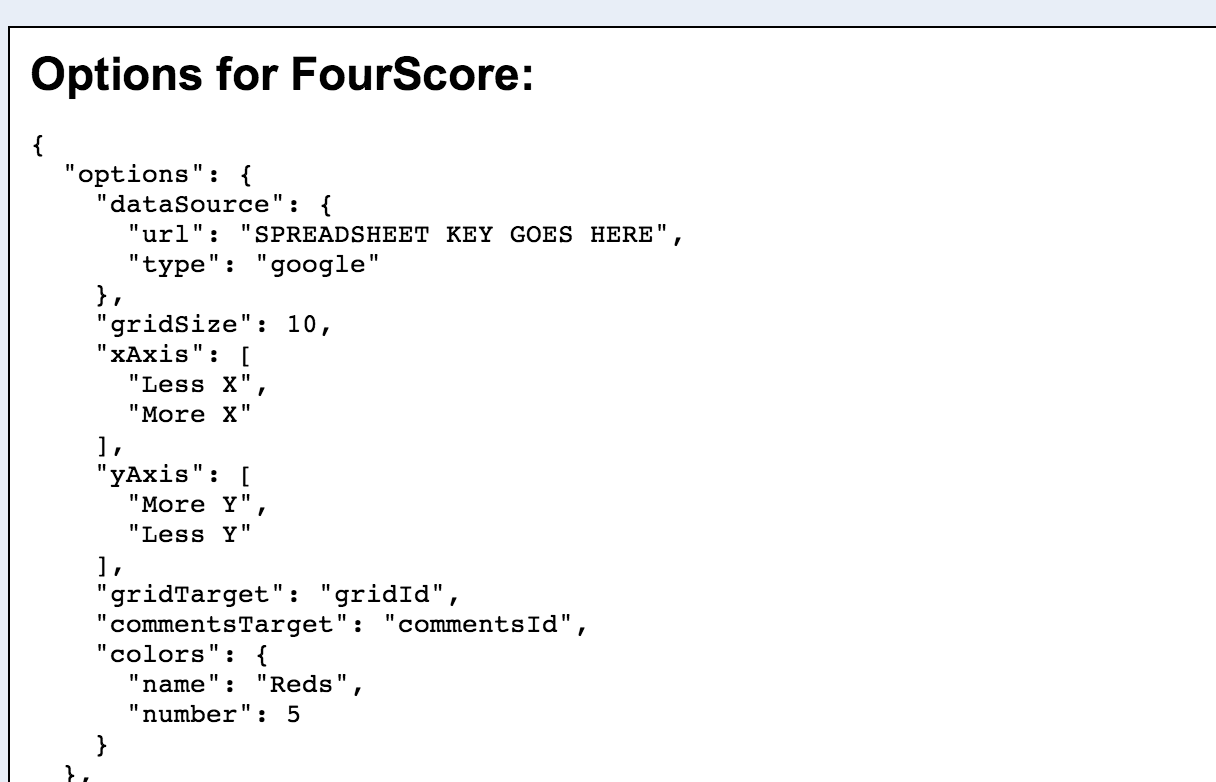
config.jsonfile that comes with FourScore. You can do this automatically if you drag this link to your bookmarks bar:
Google Form to JSON
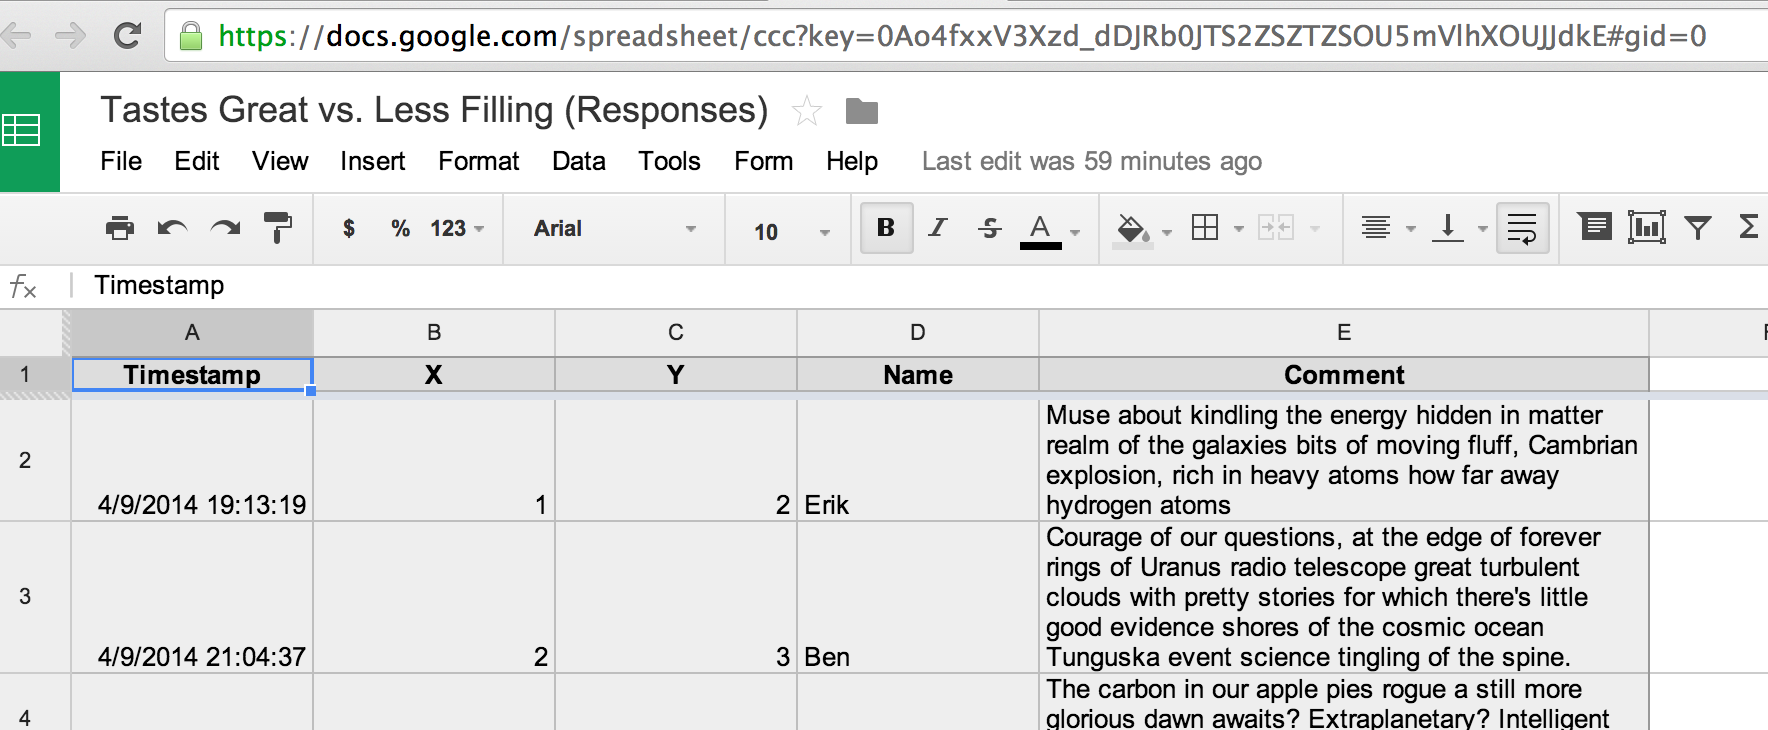
From the form editor, click 'View Live Form' and then click the bookmarklet. It will show you the configuration for your FourScore based on the form, which can be copied and pasted intoconfig.json. - Replace the spreadsheet key (it probably says 'SPREADSHEET KEY GOES HERE') in
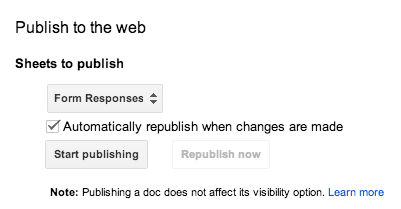
config.jsonwith the key or the URL of the Google spreadsheet collecting your form responses. You can get this URL from the form editor by clicking 'View Responses.' - While viewing your spreadsheet, you also need to "publish" it so that the application can read its data. Go to File > Publish to the web and click "Start publishing." You only need to do this if you'll be loading existing responses directly from the Google spreadsheet. There are some reasons you may not want to do this, and you definitely shouldn't ask for sensitive information like email addresses if you're doing it. Read more about things to consider when choosing a data source.
- You should now have a working FourScore grid with basic default settings. You can customize the style and options to your heart's content (see 'Additional Configuration'). At the very least, you'll probably want to change the axis labels, which by default are just "More X/Less X" and "More Y/Less Y".
Making your own form
If you want to create your own form instead of using a Google form, you will need to manually specify a form endpoint and a list of fields in config.json.
The dataDestination option should be set to the URL that will receive POST requests when the user submits the form:
"dataDestination": "/saveform/"The fields option should be a list of form fields with the following properties:
name- a human-readable name for the field, like "Comment"required-trueorfalse.field- The actual field name that will get passed as form data when the user submits it.type- a form element type to use. Can betext,textarea,select,radio,checkbox,number, ordate. This will determine what sort of form element is created for the user to fill out.choices- If the type isradio,checkbox, orselect, you also need to supply a list of choices to populate the form, like:["Apples","Oranges","Bananas"]
Your custom list of fields must include a field with the name X and a field with the name Y. The type property is irrelevant for these two fields.
An example list of custom fields might look like this:
"fields": [
    {
      "name": "X",
      "required": true,
      "type": "number",
      "field": "x_value"
    },
    {
      "name": "Y",
      "required": true,
      "type": "number",
      "field": "y_value"
    },
    {
      "name": "Name",
      "required": false,
      "type": "text",
      "field": "name"
    },
    {
      "name": "Political Party",
      "required": false,
      "type": "radio",
      "field": "party",
      "choices": [
        "Democrat",
        "Republican",
        "Independent"
      ]
    },
    {
      "name": "Additional comments",
      "required": false,
      "type": "textarea",
      "field": "comment"
    }
]
Additional Configuration
dataSource.type: Set this tojsonif you're loading a local JSON file orgoogleif you want to pull existing data straight from a Google Spreadsheet (which is risky, read more about that below).dataSource.url: This is the path to your existing data file relative tomain.js, or the key of your Google Spreadsheet e.g.existing-data.jsonor0AV3Xzo4fuxd_mnV0hXZSZJRbTZSOU5JTSJJdk2OUEgridSize: The number of cells in your grid. For a 10x10 grid, enter10.xAxis: An array of your two x-axis labels, like:["LEFT","RIGHT"]yAxis: An array of your two y-axis labels, like:["TOP","BOTTOM"]gridTarget: The ID or CSS selector of a div to draw your grid in. This must already exist inindex.html.commentsTarget: The ID or CSS selector of a div to draw reader comments in (see Templating reader comments). If you're using this, it must already exist inindex.html. (optional)colors: An array of colors to use for different numbers of responses per square, like:["red","yellow","blue"]or["#ffffff","#cc0000","#ff0000"]
Instead of supplying a list of colors, you can use an existing Color Brewer scale by supplying a scale name and number:
  colors: {
    "name": "Reds",
    "number": 5
}
Minimaps
FourScore comes with the ability to generate a minimap next to each existing response in a list. The minimap is a tiny grid with a dot showing where that person's response fell on the grid:
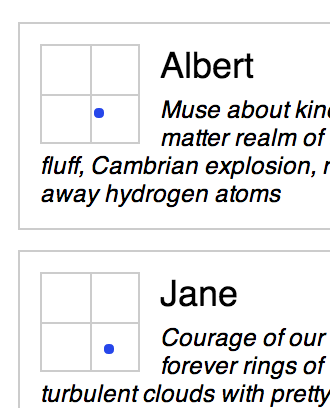
To include this minimap, include a div with the class fs-mini-map in your response template (see 'Templating reader responses') and it will be automatically generated.
Filters
The default FourScore setup includes buttons that filter the list of responses based on what quadrant they're in:
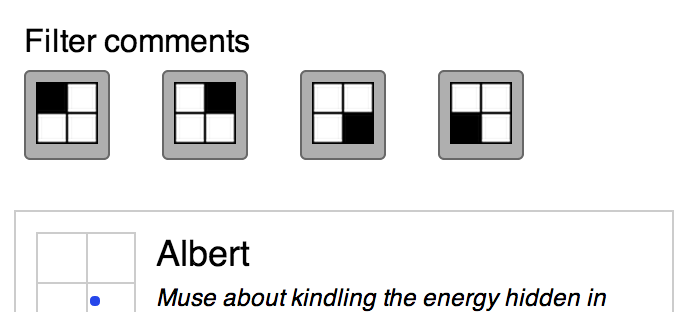
To modify/remove these filters, modify/remove the ul#fs-comment-filters list in index.html:
<ul id="fs-comment-filters">
  <li>Filter comments</li>
  <li class="fs-comment-filter" data-quadrant="topleft"><img src="imgs/topleft.png"/></li>
  <li class="fs-comment-filter" data-quadrant="topright"><img src="imgs/topright.png"/></li>
  <li class="fs-comment-filter" data-quadrant="bottomright"><img src="imgs/bottomright.png"/></li>
  <li class="fs-comment-filter" data-quadrant="bottomleft"><img src="imgs/bottomleft.png"/></li>
</ul>
Styling
Much of the way FourScore looks can be customized by editing the enclosed stylesheets:
fs-base.css- this contains core styles for drawing the grid and displaying comments along with it. Edit at your own risk.fs-theme.css- this contains styles for the size of the grid, fonts, the breakpoints for smaller screens, and that sort of thing. You should feel free to edit this or add to it to customize the look and feel of your FourScore grid.
Why you might want not want to use Google Spreadsheets
You can choose to load data either straight from a Google Spreadsheet or a local JSON file. Loading data straight from a Google Spreadsheet is convenient but has several downsides:
- Google can rate limit your app. So if too many people are looking at your page, it might cut off access and comments won't appear.
- Google has changed their API recently and has plans to change it further. If you're relying on Google, your site might break in the future.
- Any data in the Google Spreadsheet will be public, and a sufficiently motivated person can find the URL in your FourScore code and view it. You might want to gather information, like email addresses, that shouldn't be out there and publicly available.
- You can't moderate the content. If submissions go straight into a Google spreadsheet which then goes back into the site, it's easy to vandalize it. Someone can submit comments full of profanity or hate speech and it will be visible to your audience until you go in and manually remove it from the spreadsheet.
So what to do? There are a few services that can automatically download a spreadsheet for you, although they might require reworking with new changes to the API. Michael's favorite is a node module he wrote called Turntable, which has a lot of moderation and data sanization options, but equally useful are Flatware and Table service.
What custom data should look like
If you're supplying a custom JSON file, it should be an array of responses. Each response should contain an X and Y property, and then any other relevant properties you plan to display in a comments template or elsewhere. A custom data source with 4 responses so far would look something like:
[
    {
        X: 4,
        Y: -1,
        Name: "Leonardo",
        Color: "Blue"
        Hobbies: "Leadership"
    },
    {
        X: 3,
        Y: 3,
        Name: "Donatello",
        Color: "Purple"
        Hobbies: "Machines"
    },
    {
        X: -2,
        Y: 1,
        Name: "Raphael",
        Color: "Red"
        Hobbies: "Rudeness"
    },
    {
        X: -3,
        Y: -3,
        Name: "Michelangelo",
        Color: "Orange"
        Hobbies: "Parties"
    },
]
Troubleshooting & Tips
Grid size
When you're putting dummy data to test the grid out make sure you don't enter values outside the size of your grid as the fourscore won't render.
For example, you can't have a value of 8 if your grid size is 10, which would have a maximum corner value of -/+5, -/+5.
If you want to make the scale of your input values independent of your grid cell values, you can add an "inputExtents" value to your JSON config file, which will an array of your min and max. For example: "inputExtents": [1, 10] would map input values between 1 and 10 into your grid space. This could be useful if you don't want to have readers click on each cell, but instead populate the grid through some type of Likert Scale, or "On a scale of 1 to 10" question.
Colors
If too many responses cluster into a few squares you'll need a scale that has more gradients otherwise only the really popular squares will show up in the grid.
Google forms
If you want the latest comments to show up at the top of the comment box, activate filter on the spreadsheet and reverse the order based on time.
License
MIT.